Money & Markets
Free / Money & Markets
Melman on Gold & Silver
November 2010 by Leonard
As longtime readers of this column are well aware, some of our favorite lines originate from major motion pictures and one in particular from the movie Demetrius and the Gladiators comes to mind when analyzing the events of the past month. As related in the historical fiction work entitled The Robe, Demetrius was a slave who was a devout Christian during its early years. When forced into a gladiatorial battle, he offended the mad Emperor Caligula, who decided to punish him by having Demetrius torn apart by wild animals. His specific order, given in a strident voice, was “Release the tigers!”
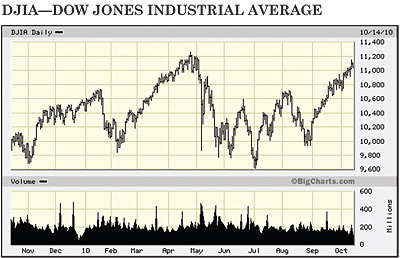
All of this came to mind while watching the world’s monetary authorities simultaneously act to “release the tiger” of monetary creation (now known as Quantitative Easing) in order to forestall an economic collapse. While many around the world applauded and the financial markets moved into new relative highs (see Dow Industrials chart), we believe what has taken truly place is that a monetary drug addict, previously suffering from the effects of prior overdoses, has been “cured” by the injection of new and greater amounts of the same monetary drugs. We discuss this issue below.
Part of the problem facing America in particular is the combination of ever-growing payments to individuals as government attempts to resolve every possible problem while revenues fail to keep pace with such expenditures. That trend continued last month with the Senate passage of the small business recovery bill that had already been approved by the House of Representatives. We review a serious published study of these expenditure trends below.
We also could not help but notice that troubles appear to be spreading around the world. Banks in Ireland are in desperate need of a governmental bailout. Workers in France are walking away from their jobs to protest an increase in the legal retirement age from 60 to 62. Miners in Spain who are vulnerable to layoffs because of discontinued European Community subsidies have been burning logs to shut down highways in that troubled nation. Protestors in Ecuador threatened the life of their President who was held hostage in a hospital for many hours. Other protestors in Britain stripped naked to arouse public anger at threats that their now-vulnerable pensions would be “stripped bare.” And, almost everywhere in Europe, new laws aimed to control Islamic inroads are raising religious-based tensions.
In addition, raising concerns around the world, economies in many nations are simply failing to respond to past stimulus activities by their governments. In America, USA Today newspaper reported that fully 30% of those presently unemployed have been without work for more than one year, and the most recent Labor Department jobs report showed continuing losses in private-sector employment. The International Monetary Fund just forecast that global growth will be slower than expected due to ever-rising levels of national debt.
Looming ever-larger as time passes, America is now awaiting perhaps the most important off-year election in decades, an election where the debate has now focused on diametrically opposed economic and governmental philosophies.
Within that background, America’s economy continued to send out mixed messages. In addition to the weak September jobs report noted above, Durable Goods Orders for August declined by a sharp 1.1% from July, and New Factory Orders and Factory Orders Backlog both fell moderately during August. Steel Capacity Utilization and Petroleum Utilization Capacity both fell from August to September, indicating continuing weakening of demand for basic industrial production materials.
On the plus side, Wholesale Sales improved slightly in August; Initial Jobless Claims for late September improved moderately; Help Wanted Advertising increased by 1.5% from August to September; and, in addition, Personal Income showed a slight uptick from July to August.
One other figure dominated the news as the United States National Debt rose by more than one hundred fifty billion dollars during the past month alone, standing at an incredible $13.624 trillion as of October 11, 2010, fully $1.715 trillion above the year-earlier number. Money supply figures for M-1 and M-2 also rose during the most recent report.
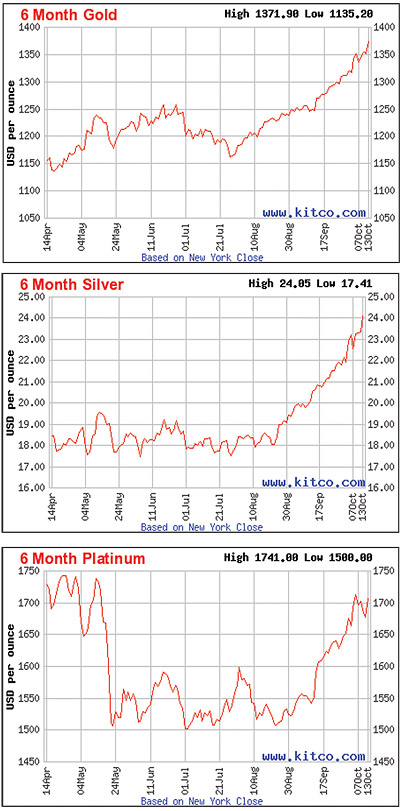
Inside this background, gold and silver put on strong performances with gold rising by almost $100 per ounce during the month to near $1,375 at presstime, while silver surged even further on a percentage basis to just above $24.00 per ounce. Base metals such as copper, nickel, lead and zinc also rose sharply along with platinum and palladium, and our lists show a strong predominance of plus signs. In fact, several shares showed oversized gains of 20, 30, 40 and even 50+% during the month.
_______________
Environmentalists got a major shot in the arm for their anti-mining propaganda with the announcement in early October that a major toxic materials spill had occurred at an aluminum mining complex in Hungary. Pictures of bright red sludge flowing into communities and polluting important rivers, such as the Danube, were shown around the world, and news of the deaths of seven persons related to the spill gave added weight to the negative impressions.Unfortunately, this is the third major pollution episode during the past two years and all of these occurrences have served to advance the environmentalists’ arguments. In the first case, approximately 500 ducks perished a
 fter alighting in a waste pond associated with oil sands operations in northern Alberta, and in the second and much more important case, we had the enormous oil spill in the Gulf of Mexico last spring/summer.
Mining executives and others interested in the success of all resource industries must be prepared for an attempted onslaught of new and invasive environmental laws and regulations.
_______________
However, on the plus side of mining news, as opposed to the environmental story noted above, mining in general and mining technology in particular got a tremendous public relations—and humanitarian—shot-in-the-arm with the successful rescue of the Chilean miners trapped more than two months ago in a mining collapse about 2,000 feet (650 meters) below the surface of the Atacama Desert.People marveled at the inventiveness of mining equipment manufacturers and operators who were able to pin-point the location of the survivors, drill an immediate narrow-core hole that enabled the provision of essential life-savings supplies, and wondered at the stunning accuracy of the actual wider-dimension rescue hole itself through which the miners were hoisted to the surface.
In fact, the entire rescue operation truly bordered on the miraculous.
_______________
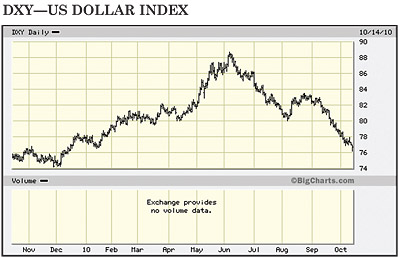
Simply put, currency markets around the world are in turmoil. The US Dollar has entered a renewed period of swift decline (see Dollar Index chart); currency creation is accelerating in what Guido Mantega, the Brazilian finance minister, called an “international currency war” and a new international language is being created to describe what is happening. In a Financial Times quote, Mantega noted, “We’re in the midst of an international currency war, a general weakening of currency.”What is occurring, quite simply, is that nation after nation is attempting to reduce the comparative value of their currencies to gain international trading advantages. The means of achieving such devaluations has historically been to create massive new quantities of their home currency, thereby “watering down” its value and thus making their exported goods comparatively cheaper.
Thanks to such actions, among the new phrases being utilized one might find such items as, “A Race to the Bottom,” or “Beggar Thy Neighbor.” We would also suggest that interested persons should also bone up on their reading regarding past hyperinflation as it appears to this columnist that the same failures of policies that led to prior historic monetary debacles are now being re-enacted right before our very eyes.
In America, one of the monetization mechanisms being used is an operation where the Federal Reserve Board purchases valid US Treasury debt obligations with newly-created currency units. It then takes these government debt obligations onto its books as an “asset.” By early October, the amount of US Government Securities that had been bought outright by the Fed had soared from $1.594 trillion one year ago to $2.047 trillion, a gain of more than $450 billion in just one year. The Fed is not alone as the Bank of Japan just announced a two trillion yen purchase program of its own government debt.
According to a Wall Street Journal study, other important nations such as Brazil and the UK are also engaged in such policies, as well as several other nations holding less international impact. Together, they are creating a situation which Nobel Economics prize-winner Robert Mundell has described as, “...a terrible thing for the world economy... We’ve never been in this unstable position in the entire currency history of 3,000 years.” (Our emphasis.)
And yet, the Federal Reserve Board appears to be unaware of the dangers implicit in massive currency creation as the most recent Fed meeting minutes called for “Aggressive Action” to charge up the economy and Fed Chairman Ben Bernanke reiterated his belief that Japan’s economic slowdown of the past 20 years resulted from insufficient action by Japan’s central bank, an error he most definitely plans not to duplicate.
Gold’s greatest previous bull market took place in 1977-1980 amidst currency instability, and we cannot help but note the similarities between the present and that past era.
_______________
When we hear talk of governments’ willingness to engage in “Austerity” measures, we accept such talk with a degree of skepticism. In the first place, one great problem is that many recipients have come to accept government largesse as a “right” and bitterly resent any attempt to reduce such movements of cash from national treasuries into their personal wallets. In the second place, particularly in the United States of America, much of the social structure as well as the economic structure now revolves around government entitlement payments to an important extent, and we believe it would prove immensely difficult to disengage such activities.Financial writer Sara Murray recently presented a detailed study regarding such entitlements and her information is vitally important, in our opinion. Some of the detailed facts truly border on the incredible, leading off with this tidbit: “Nearly half of all Americans live in a household in which someone received government benefits, more than at any time in history... At the same time, the fraction of American households not paying Federal income tax has also grown—to an estimated 45% in 2010, from 39% five years ago...” We can only wonder just how an ever-diminishing number of “payers” can support an ever-increasing number of “payees.”
But there is much more. There appears to be an inherent belief among the American public that the unbelievable is, in fact, believable as 61% of potential voters said they approved of candidates who talked about cutting federal spending but, at the same time, 56% approved of those politicians who supported such expensive programs as the recent extension of unemployment benefits.
Some of the government-recipient numbers are staggering. For examples, 41.3 million people were on food stamps in June 2010; 9.7 million people were receiving unemployment benefits in August 2010; the number of persons getting federal aid to purchase medical insurance is now on the rise and should increase rapidly through 2019; the “Making Homes Affordable Program” is enrolling increasing numbers to receive government mortgage assistance; and the expansion of the Medicare and Medicaid programs is, in our opinion, utterly unsustainable. In 1990, the number of recipients was about 35 million. By 2010, it had risen to over 47 million, and by 2030—just twenty years away—it is expected to soar to over 80 million!
The trend to greater involvement—and expense—for government social welfare programs has taken on an air of relentlessness for over 70 years, starting with FDR’s Social Security Act of 1935. This was followed by new and major programs such as the GI Bill of the late 1940s; children’s lunch programs of the 1950s; LBJ’s social welfare programs of the “Great Society” in the 1960s (including Medicare and Medicaid); Supplemental Security programs and subsidized rental housing Section 8 vouchers of the 1970s, and numerous new and complex programs that have been added in the years leading to the present.
All of these programs are now thoroughly integrated into the American body, and we believe it will be truly difficult—both politically and financially—for the government to extricate itself from these obligations.
That is one of the reasons why we do not foresee any immediate solution to the debt and deficit problems now threatening America’s financial future and provides yet another reason why gold continues to advance to new record high levels.
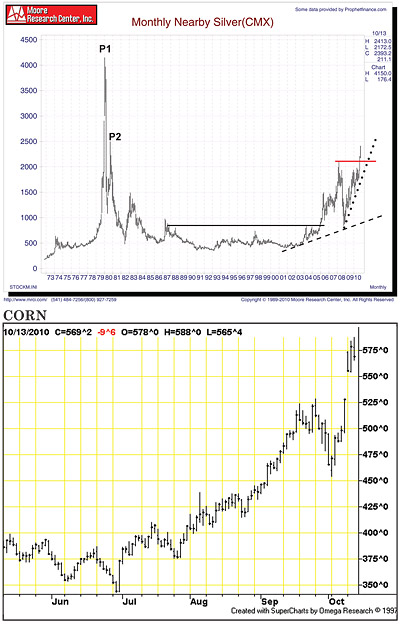 _______________
Chart Analysis—Long-Term Silver
The long-term (30-year) silver chart is telling us a remarkable story, one that is every bit as fascinating as silver’s “big brother,” gold.After surging from under $2.00 per ounce to over $5.00 in the early 1970s, silver traded quietly for a few years before surging to over $40.00 per ounce during the famous “Hunt Brothers Rally” in early 1980 (P1). Silver then crashed to just above the $10.00 level before rising to a second peak at $25.00 (P2) late in 1980.
Following a second sharp sell-off and a subsequent rally, silver went into a twenty-year quite period, trading under the black solid line below $8.00 before roaring back to life in 2005, when a strong rally eventually reached a peak near $22.00 per ounce in early 2008, before a dramatic decline pulled the price back to the original breakout point at $8.00 in late 2008.
From that point forward, silver has been strongly bullish, outperforming gold on a percentage basis. Silver’s rally moved from $8.00 to $23.50 by mid-October 2010, a gain of almost 200 percent, while gold was rising from $675 to about $1,350 in the same period, an advance of “only” 100%. Silver now rides above two rising trendlines; the first formed by connecting the bottoms of 2003 and 2008 (dashed line) and the second, and steeper, rising trendline (dotted line) formed since late 2008. Adding to the bullish scenario, silver has just broken above a rising right angle triangle formed by the dotted rising trendline and the horizontal line (red solid line) marking the previous high of early 2008.
It is also worth noting that the trading anomaly of early 1980 did not represent “normal” supply/demand market considerations, but has been regarded as somewhat artificial thanks to the Hunt Brothers’ efforts to control the silver market. In our opinion, the secondary peak of silver at P2 in late 1980 represents a much more realistic supply/demand peak price level and, if this is true, silver is now on the verge of breaking into a new historic, market-related, all-time high price range.
_______________
Our “World of Gold Indicators are as follows:(Note: A “Positive” rating means the situation is beneficial for precious metal prices.)
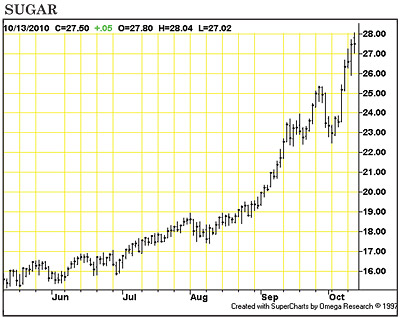
INFLATION—Changes to NEUTRAL. Major upward pressure is building in a number of commodities, including normally quiet items such as sugar and corn (see charts), joining precious and base metals as well as the petroleum complex—all of which are already advancing sharply.
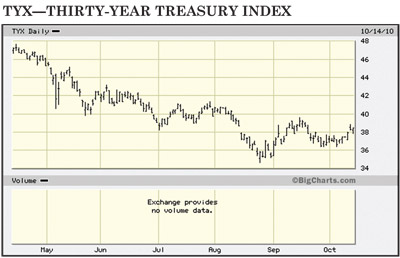 INTEREST RATES—Remains NEGATIVE. Both short-term and long-term rates remain at historic low levels. However, we would note that some support is beginning to appear in the 30-year rate chart (see TYX chart).
INTERNATIONAL TEMPERATURE—Remains POSITIVE. Military tensions remain at a high level as negotiations between the Palestinians and Israel are breaking down. In addition, social and economic unrest appears to be spreading into many parts of the globe.
US DOLLAR—Changes to POSITIVE. As noted earlier, the US Dollar is coming under heavy selling pressure and the US Dollar Index is now within just a few points of its historic record low levels.
US ECONOMIC TEMPERATURE—Remains POSITIVE. Continued economic difficulties appear to have forced the Federal Reserve’s hand in the direction of massive currency creation in order to stimulate economic activity.
US POLITICAL CONFIDENCE—Remains POSITIVE. Seldom have we ever witnessed such bitter disagreements between parties and such strident disapproval of the entire law-making apparatus of America. The campaign for America’s upcoming election of November 2 appears to have heightened the appearance of political conflict.
WORLD’S STOCK MARKETS—Remains NEGATIVE. Despite the ongoing monetary controversies and evidence of continuing economic difficulties, most major securities markets have now reached new relative highs for the past eighteen months.
GOLD’S TECHNICAL POSITION—Remains POSITIVE. If we had a category for “super-positive,” that would be appropriate for gold at the moment. All three trends, short-term, intermediate and long-term are now bullish and gold has broken out to new historic highs. All technical signs appear to be pointing toward further price gains, at least for the moment.
TOTAL SCORE: Positive, 5; Neutral, 1; Negative, 2.
_______________
Final Thoughts...We apologize for not following up on our suggestions noted last month regarding reporting on mining stories or price inflation in the world’s foodstuffs. However, we believe the looming monetary crisis combined with America’s November 2 election—which will occur almost to the day you receive this issue—were of primary importance at this time.
We do plan to follow-up on both topics next month, along with a thorough review of the results from that all-important election.
Until next month, happy prospecting and good luck!

© ICMJ's Prospecting and Mining Journal, CMJ Inc.